| Title | Information Visualization |
| Standard Abbreviation | Inf. Vis. |
| Type of Publication | Journal |
| Discipline | Computer Vision and Pattern Recognition (Q3) |
| Impact Score | 3.18 |
| SCImago Journal Rank (SJR) | 0.462 |
| h-index | 51 |
| Overall Rank | 11075 |
| Publisher Name | SAGE Publications Inc. |
| Publication Country | United States |
| International Standard Serial Number (ISSN) | 14738724, 14738716 |
| Coverage and History | 1997, 2002-2022 |
| Best Quartile | Q3 |
| Total Citations Received (Last 3 Year) |
166 |
Information Visualization is a journal published by SAGE Publications Inc.. This journal covers the area[s] related to Computer Vision and Pattern Recognition, etc.
The coverage history of this journal is as follows: 1997, 2002-2022.
The rank of this journal is 11075. This journal's impact score, h-index, and SJR are 3.18, 51, and 0.462, respectively. The ISSN of this journal is/are as follows: 14738724, 14738716.
The best quartile of Information Visualization is Q3.
This journal has received a total of 166 citations during the last three years (Preceding 2022).
The latest impact score (IS) of the Information Visualization is 3.18. It is computed in the year 2023 as per its definition and based on Scopus data.
3.18
It is increased by a factor of around 0.11, and the percentage change is 3.58% compared to the preceding year 2021, indicating a rising trend.
The impact score (IS), also denoted as the Journal impact score (JIS), of an academic journal is a measure of the yearly average number of citations to recent articles published in that journal. It is based on Scopus data.
Impact Score 2022 of Information Visualization is 3.18. If a similar upward trend continues, IS may increase in 2023 as well.
| Year | Impact Score (IS) |
|---|---|
| 2023/2024 | Coming Soon |
| 2022 | 3.18 |
| 2021 | 3.07 |
| 2020 | 1.41 |
| 2019 | 2.10 |
| 2018 | 1.84 |
| 2017 | 1.49 |
| 2016 | 1.59 |
| 2015 | 1.65 |
| 2014 | 2.12 |
The h-index of Information Visualization is 51. By definition of the h-index, this journal has at least 51 published articles with more than 51 citations.
The h-index (also known as the Hirsch index or Hirsh index) is a scientometric parameter used to evaluate the scientific impact of the publications and journals. It is defined as the maximum value of h such that the given Journal has published at least h papers and each has at least h citations.
The International Standard Serial Number (ISSN) of Information Visualization is/are as follows: 14738724, 14738716.
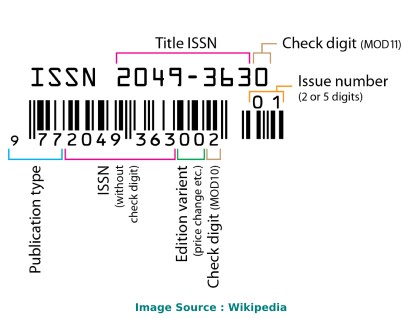
The ISSN is a unique 8-digit identifier for a specific publication like Magazine or Journal. The ISSN is used in the postal system and in the publishing world to identify the articles that are published in journals, magazines, newsletters, etc. This is the number assigned to your article by the publisher, and it is the one you will use to reference your article within the library catalogues.
ISSN code (also called as "ISSN structure" or "ISSN syntax") can be expressed as follows: NNNN-NNNC
Here, N is in the set {0,1,2,3...,9}, a digit character, and C is in {0,1,2,3,...,9,X}
The Information Visualization is ranked 11075 among 27955 Journals, Conferences, and Book Series.
As per SJR, this journal is ranked 0.462.
SCImago Journal Rank is an indicator, which measures the scientific influence of journals. It considers the number of citations received by a journal and the importance of the journals from where these citations come.
The publisher of Information Visualization is SAGE Publications Inc.. The publishing house of this journal is located in the United States. Its coverage history is as follows: 1997, 2002-2022.
Please check the official website of this journal to find out the complete details and Call For Papers (CFPs).
The International Organization for Standardization 4 (ISO 4) abbreviation of Information Visualization is Inf. Vis.. ISO 4 is an international standard which defines a uniform and consistent system for the abbreviation of serial publication titles, which are published regularly. The primary use of ISO 4 is to abbreviate or shorten the names of scientific journals using the technique of List of Title Word Abbreviations (LTWA).
As ISO 4 is an international standard, the abbreviation ('Inf. Vis.') can be used for citing, indexing, abstraction, and referencing purposes.
If your area of research or discipline is related to Computer Vision and Pattern Recognition, etc., please check the journal's official website to understand the complete publication process.
There are several factors that influence the acceptance rate of any academic journal. Here are some critical parameters that are considered while calculating the acceptance rate:
The simplest way to find out the acceptance rate or rejection rate of a Journal/Conference is to check with the journal's/conference's editorial team through emails or through the official website.
The latest impact score of Information Visualization is 3.18. It is computed in the year 2023.
The latest h-index of Information Visualization is 51. It is evaluated in the year 2023.
The latest SCImago Journal Rank (SJR) of Information Visualization is 0.462. It is calculated in the year 2023.
The latest ranking of Information Visualization is 11075. This ranking is among 27955 Journals, Conferences, and Book Series. It is computed in the year 2023.
Information Visualization is published by SAGE Publications Inc.. The publication country of this journal is United States.
This standard abbreviation of Information Visualization is Inf. Vis..
Information Visualization is a journal published by SAGE Publications Inc..
The scope of Information Visualization is as follows:
For detailed scope of Information Visualization, check the official website of this journal.
The International Standard Serial Number (ISSN) of Information Visualization is/are as follows: 14738724, 14738716.
The best quartile for Information Visualization is Q3.
The coverage history of Information Visualization is as follows 1997, 2002-2022.
Note: The impact score shown here is equivalent to the average number of times documents published in a journal/conference in the past two years have been cited in the current year (i.e., Cites / Doc. (2 years)). It is based on Scopus data and can be a little higher or different compared to the impact factor (IF) produced by Journal Citation Report. Please refer to the Web of Science data source to check the exact journal impact factor ™ (Thomson Reuters) metric.
| Journal/Conference/Book Title | Type | Publisher | Ranking | SJR | h-index | Impact Score |
|---|---|---|---|---|---|---|
| Journal of Applied Business Research | Journal | 23890 | 29 | 0.28 | ||
| British Journal of Special Education | Journal | Wiley-Blackwell Publishing Ltd | 12024 | 42 | 1.24 | |
| Howard Journal of Communications | Journal | Taylor and Francis Ltd. | 9564 | 36 | 1.66 | |
| Sapporo Medical Journal | Journal | Cancer Research Institute, Sapporo Medical University | 20468 | 3 | 0.00 | |
| Population Review | Journal | Sociological Demography Press | 17841 | 13 | 0.73 | |
| Biological Procedures Online | Journal | BioMed Central Ltd. | 3350 | 43 | 6.40 | |
| Museum Management and Curatorship | Journal | Routledge | 8168 | 37 | 2.65 | |
| Journal of Sociology | Journal | SAGE Publications Ltd | 6009 | 58 | 3.21 | |
| International Journal of Pest Management | Journal | Taylor and Francis Ltd. | 13393 | 50 | 1.50 | |
| Brazilian Symposium of Computer Graphic and Image Processing | Conference And Proceedings | 16004 | 32 | 0.00 |
| Year | Impact Score (IS) |
|---|---|
| 2023/2024 | Updated Soon |
| 2022 | 3.18 |
| 2021 | 3.07 |
| 2020 | 1.41 |
| 2019 | 2.10 |
| 2018 | 1.84 |
| 2017 | 1.49 |
| 2016 | 1.59 |
| 2015 | 1.65 |
| 2014 | 2.12 |
 3.18
3.18
 0.462
0.462
 51
51
 11075
11075